
Private Team Workshop
Let’s Fix How Your Team Presents Data
A live 2.5-hour virtual workshop on the design and structure choices behind charts, slides, reports, and dashboards that stakeholders read once and act on.
The Solution
2 Hours of Training + 30 Min Live Report Audit
00:00 – 00:15
Welcome & Introductions
Quick intros and what good looks like for the session.
00:15 – 00:45
Reading Your Audience: When to Explore vs. When to Explain
Diagnose what your audience needs and how that choice drives structure and design.
00:45 – 01:15
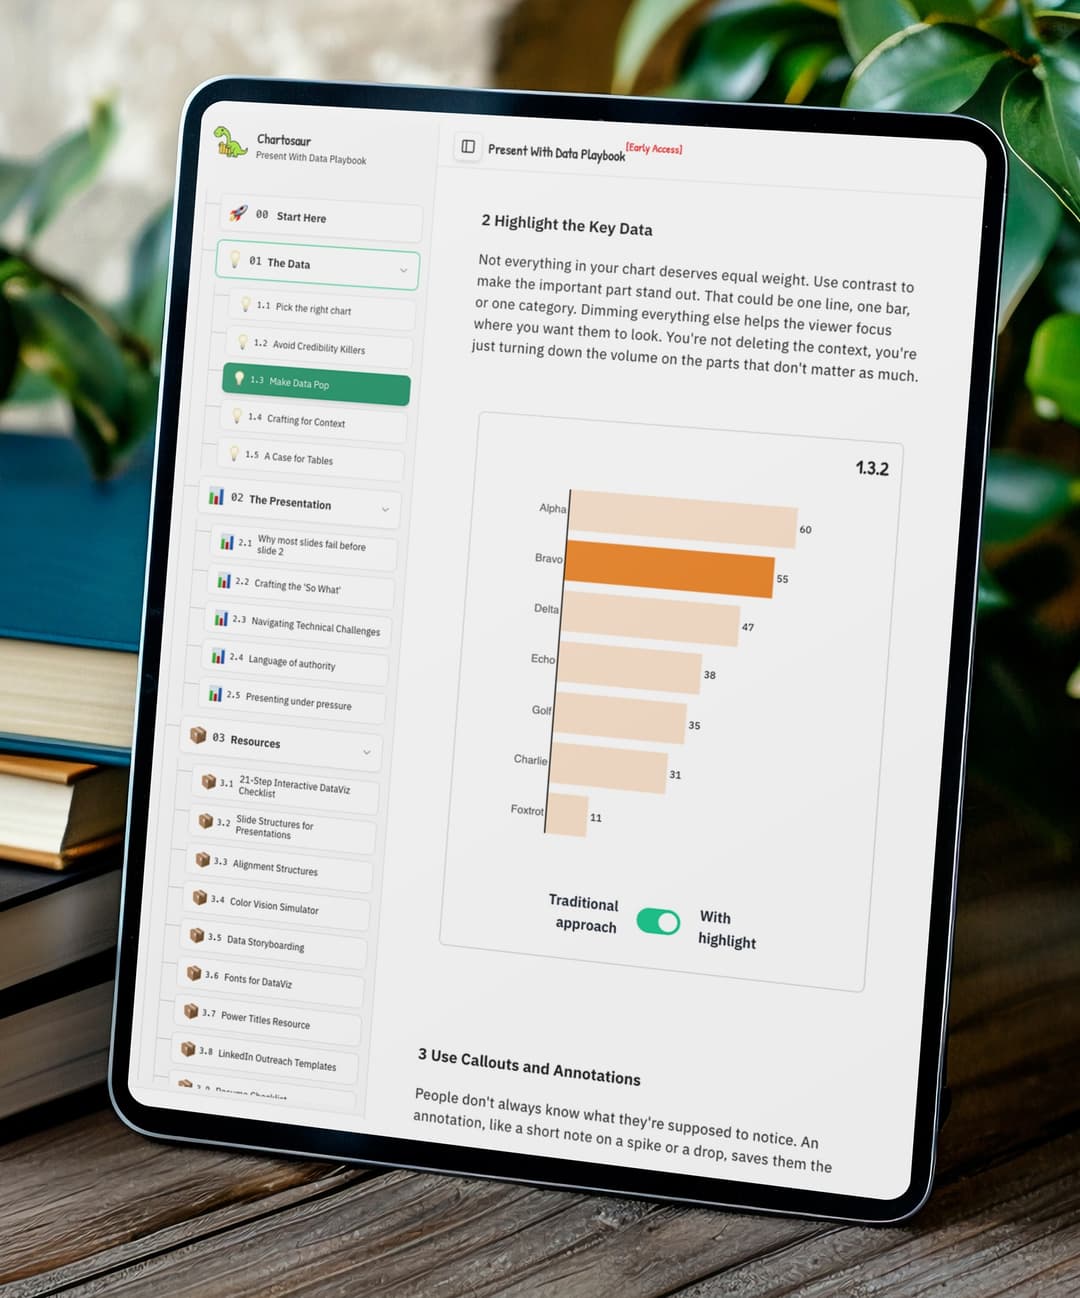
Cutting Noise, Making the Message Land
Highlight the main message, remove noise, and make charts readable in seconds.
01:15 – 01:45
Data Storytelling Frameworks
Repeatable frameworks for turning complex findings into a clear story.
01:45 – 02:00
Credibility Checks & Professional Polish
A practical checklist to catch credibility killers before they ship.
02:00 – 02:30
Live Audit & Dashboard Workshop
Bring real reports from your team. We audit them live for clarity, structure, and credibility.
Included for every participant
Present with Data Playbook
Lifetime access for every attendee. Checklists, palettes, and templates included.
Full Slide Deck
Every slide from the session, yours to keep and reference.

Who this is for
Teams whose work lives or dies in a chart, slide, or report.
- Analytics, BI, & data teams who present findings to leadership
- Marketing & growth teams who report on campaigns & experiments
- Finance & ops teams who run monthly & quarterly reviews
- Insights, evaluation, & QA teams whose reports go to clients, funders, or executive leadership
- Founders, PMs, & consultants who package data work for stakeholders
Book a Session for Your Team
Tell us a little about your team and we’ll follow up to schedule your workshop.