Isochrones
Mapping Access in Minutes, Not Miles
October 5, 2025 • 5 min read
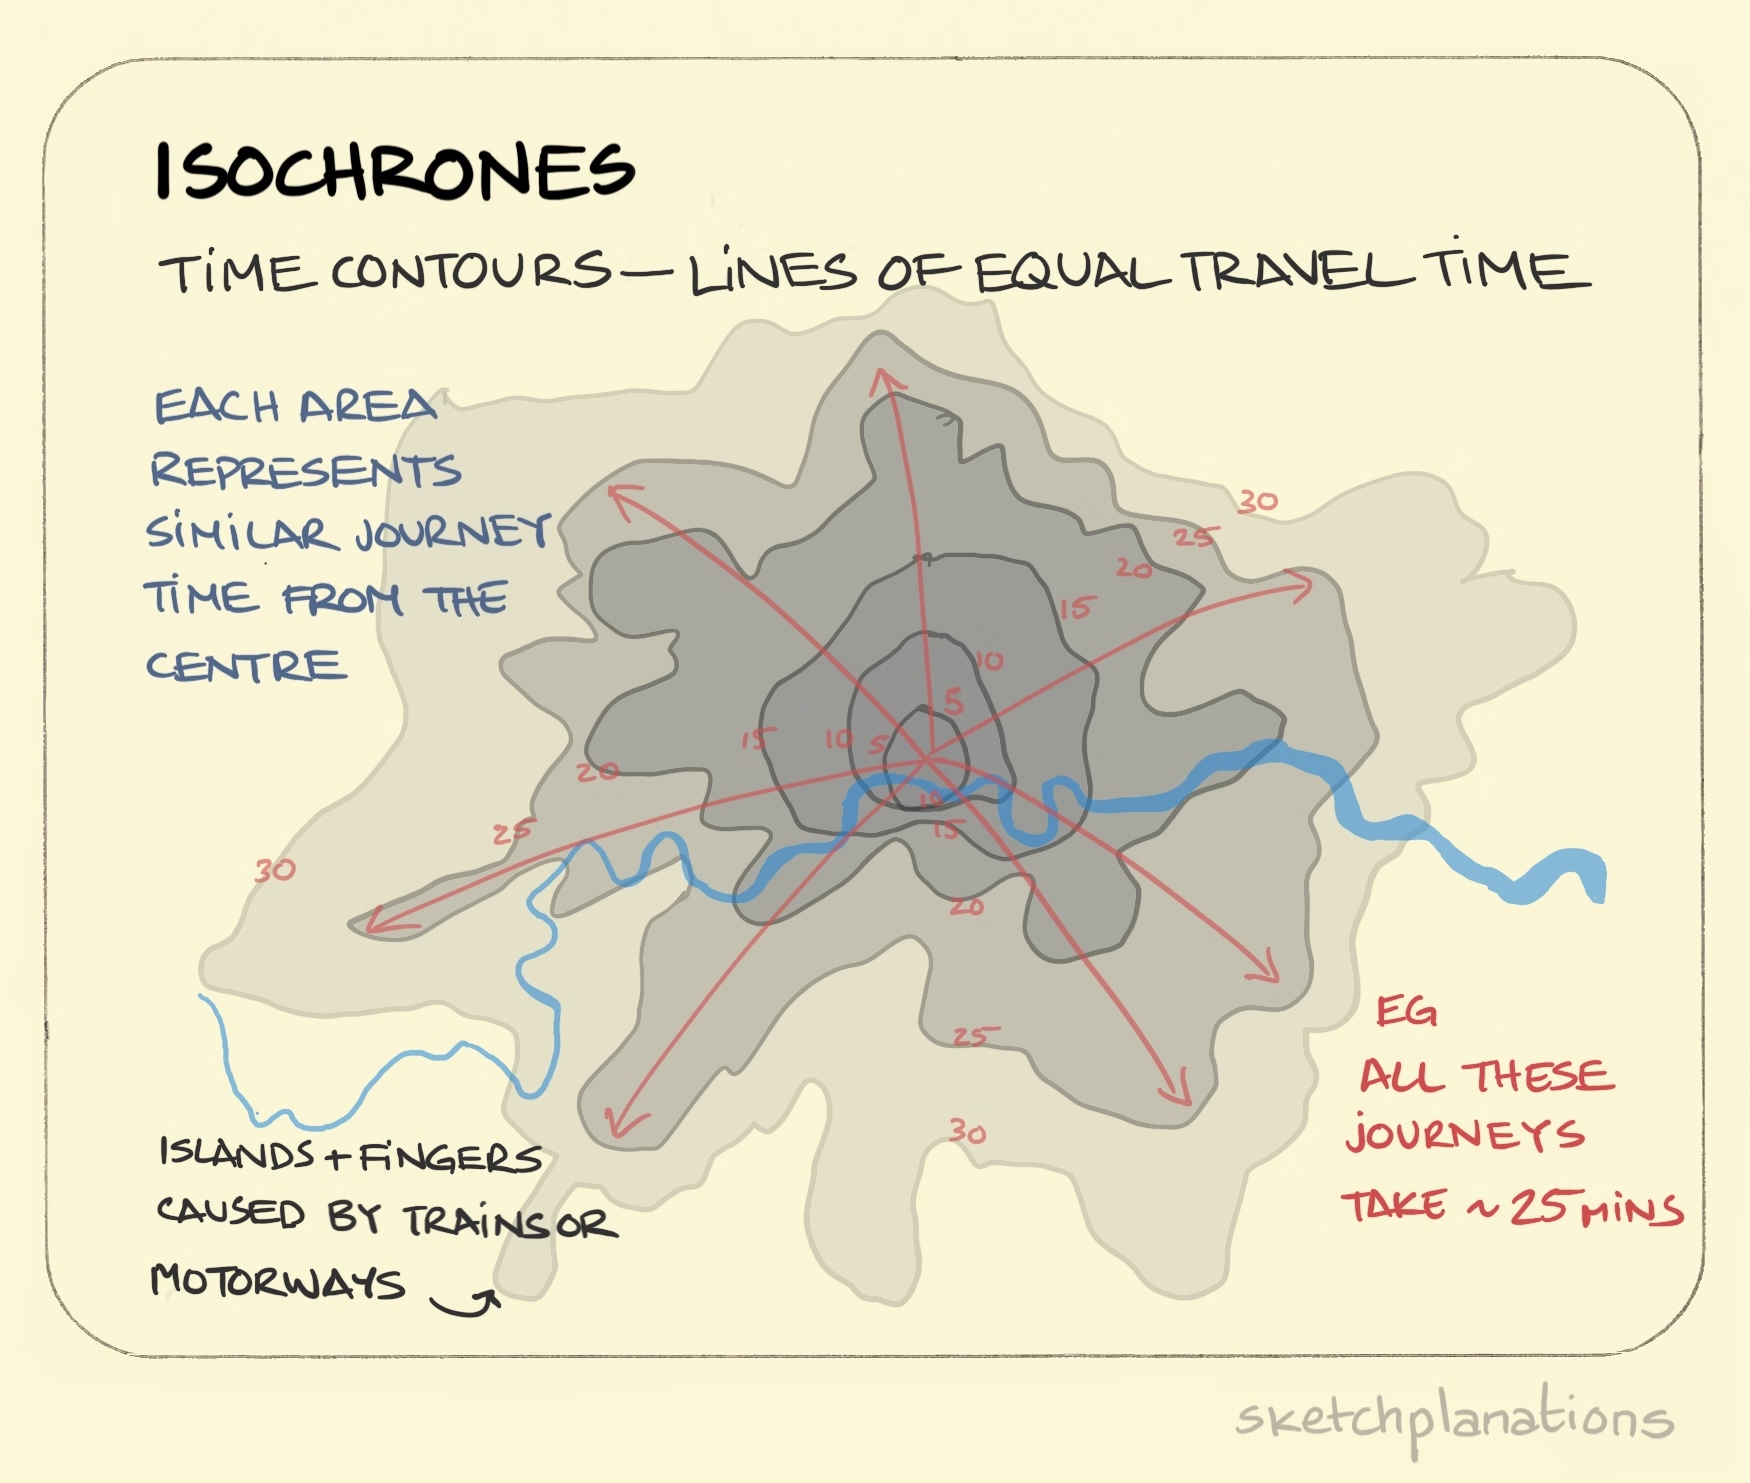
What is an isochrone
Isochrones are maps that draw a line around what you can reach in a set amount of time. Drop a pin on a location and ask for a fifteen minute travel window. The model calculates every possible route outward until the time runs out and then draws the edge.
The result is not a perfect circle because life does not move evenly.
Roads, traffic, hills, and networks pull and squeeze that shape into something that actually looks like the way we travel. Two stores might both sit five miles away from your house, but one takes ten minutes and the other takes twenty five. Isochrones show that difference immediately.
Applications of isochrones in real work
You will find isochrones anywhere people care about access. They are not only for planners or academics. They show up in business strategy, logistics, and even recreation analysis. Here are a few places where they add real value:
- Urban planning to measure how many residents can reach a park or clinic in a set time by different modes of transport.
- Retail analysis to compare reach by drive time and spot underserved areas.
- Transit design to see where bus or subway coverage overlaps or leaves gaps for short trips.
- Emergency response to simulate how long fire or ambulance crews actually need to reach a neighborhood under traffic conditions.
- Logistics and delivery to test what areas are truly reachable within promised time windows.
One example that makes this idea click comes from Toronto. The map compares travel times by bicycle and transit.
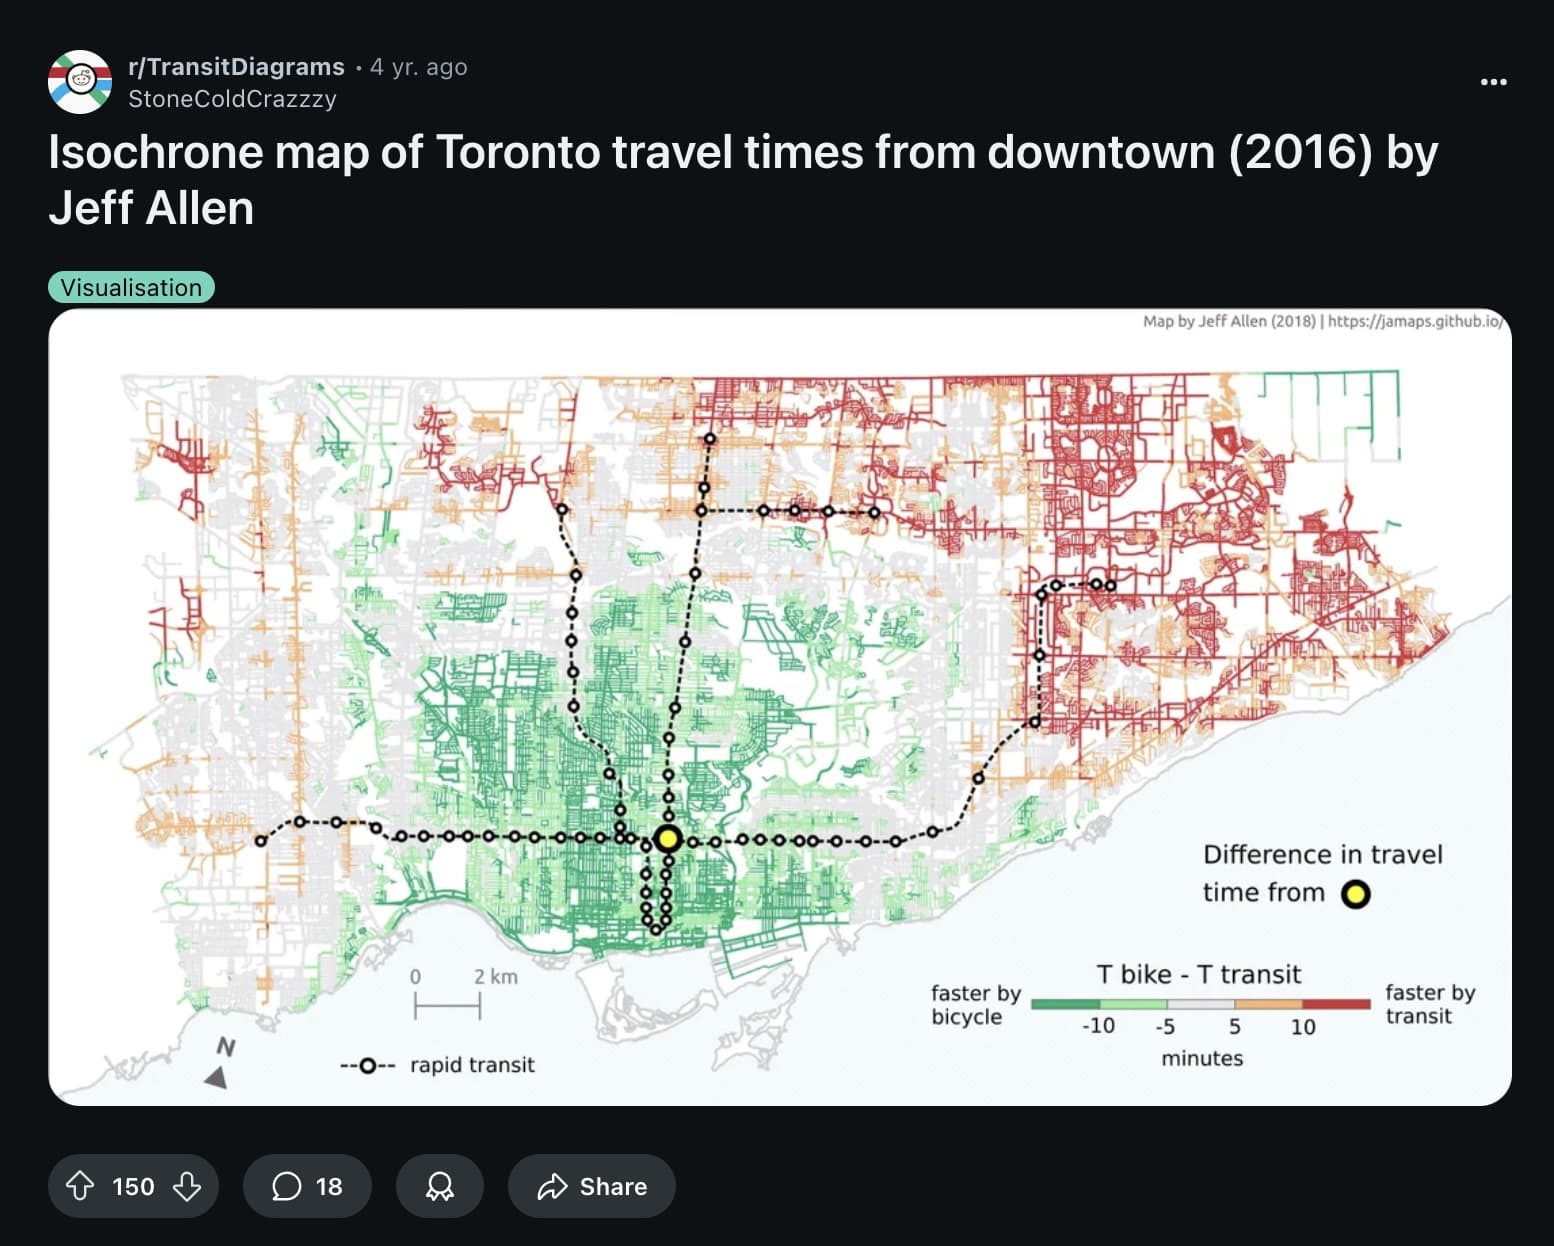
Green shows where a bike is faster and red shows where transit is faster. That framing is intentional. It centers the question on which mode is quicker from this station rather than on absolute travel time, which is useful when the goal is to analyze which mode to choose for a given trip.
It is a really really cool data story about access!
What can you control
Isochrones rely on routing models that simulate movement through a network. You have to control some of the knobs...
Here are a few variables that matter most when you are building or evaluating an isochrone.
- Mode of transport
- drive, walk, cycle, transit
- multi-mode combinations
- average travel speed assumptions
- Traffic and timing
- peak or off-peak conditions
- live or historical traffic feeds
- specific time of day or day of week
- Network interpretation
- road or path types to include or ignore
- access restrictions (pedestrian only, toll roads, etc.)
- speed multipliers by road class (adjust assumed speeds for road types)
- surface or slope weighting (account for rough terrain or elevation)
- Model parameters
- maximum travel time (time budget for the isochrone)
- polygon smoothing or generalization
- time unit and rounding
Data sources
- OpenStreetMap (OSM) – the base layer for most open routing engines. It includes road geometry, paths, and access restrictions.
- OpenRouteService – built on OSM. Offers a free API for car, bike, walk, and transit isochrones. Easy to use and widely supported.
- TomTom and Mapbox APIs – commercial options with live traffic data, time-dependent routing, and high-quality road attributes. Ideal for production or business use.
- Esri Network Analyst – available through ArcGIS Online or Pro. More enterprise-oriented but integrates with standard GIS workflows.
If you are new, start with OpenRouteService. It is free to try and gives a clean JSON polygon you can visualize or join against your own data.
Building one in Python
Here is a minimal starter to generate a fifteen minute drive-time isochrone from an address using the OpenRouteService API. You just need an API key from their website.
import openrouteservice
from openrouteservice import convert
import geopandas as gpd

# Initialize client with your API key
client = openrouteservice.Client(key="YOUR_ORS_API_KEY")

# Example point: Toronto city center
coords = (-79.3832, 43.6532)

# Build a 15-minute isochrone (900 seconds)
iso = client.isochrones(
    locations=[coords],
    profile="driving-car",
    range=[900],
    attributes=["area", "reachfactor"]
)

# Convert GeoJSON to GeoDataFrame for easy plotting or analysis
gdf = gpd.GeoDataFrame.from_features(iso["features"])
gdf.plot(color="lightgreen", edgecolor="black")